Some advanced debugging techniques for Visual Studio 2015
- Andreas Heindl
- info@heindl-solutions.com
- http://www.heindl-solutions.com/
Agenda:
- Visualizers
- StepFilter
- Debug.EvaluateStatement / ?
- Piecewise execution of a statement
- Attach debugger automatically
Visualizers
- Create custom visualization of data
- Complex definitions possible
- .natvis files are stored in Visual Studio project (even in pdb)
// 01_visualizers / main.cpp
#include <string>
#include <memory>

struct Circle {
    double cx, cy, r;
};

struct Container {
    std::shared_ptr<Circle> c1, c2;
    Container(std::shared_ptr<Circle> c1,
              std::shared_ptr<Circle> c2)
        : c1(c1), c2(c2) {};
};

int main() {
    auto c1 = std::shared_ptr<Circle>(
        new Circle{100.0, 200.0, 10.0});
    auto c2 = std::shared_ptr<Circle>(
        new Circle{144.0, 222.0, -33.0});
    auto container = std::make_shared<Container>(
        c1, c2);
    // watch container with .natvis visualizer
    __debugbreak();
}
Visualizers
- Add to project:
Add / New Item / Visual C++ / Utility / Debugger visualization file (.natvis).
Alternative: Store in %USERPROFILE%\Documents\Visual Studio 2015\Visualizers - Enable Natvis diagnostics:
Tools / Options / Debugging / Output Window / Natvis diagnostic messages (C++ only) option.The errors are displayed in the Output window. - MSDN: Creating custom views of native objects in the debugger
- MSDN:Format Specifiers in C++
Example .natvis
<?xml version="1.0" encoding="utf-8"?>
<AutoVisualizer xmlns="http://schemas.microsoft.com/vstudio/debugger/natvis/2010">
<Type Name="std::shared_ptr<Container>">
<DisplayString>{_Ptr->c1,g}, {_Ptr->c2,g} (d2={(((_Ptr->c1._Ptr->cx-_Ptr->c2._Ptr->cx) * (_Ptr->c1._Ptr->cx-_Ptr->c2._Ptr->cx) + (_Ptr->c1._Ptr->cy-_Ptr->c2._Ptr->cy) * (_Ptr->c1._Ptr->cy-_Ptr->c2._Ptr->cy))),g})</DisplayString>
</Type>
<Type Name="std::shared_ptr<Circle>">
<DisplayString Condition="_Ptr->r < 0">(cx={_Ptr->cx,g}, cy={_Ptr->cy,g}, r={_Ptr->r,g} (INVALID))</DisplayString>
<DisplayString>(cx={_Ptr->cx,g}, cy={_Ptr->cy,g}, r={_Ptr->r,g})</DisplayString>
</Type>
</AutoVisualizer>Stepfilter
- Useful to skip stepping into uninteressting calls
- Do not skip too much. For example
std::.*
skipsstd::make_shared
// 02_stepfilters / main.cpp
#include <string>

struct MyWidget {
  MyWidget(const char* s) {}
};

void setNameWidget(const std::string& name, const MyWidget& w) {
  /* TODO: Debug me */
}

int main()
{
  const char* name = "myName";
  __debugbreak();
  /* Debugging task: Step into setNameWidget()
   * typical sequence: F11, Shift+F11, F11, Shift+F11, F11
   * use step filter in
   * %USERPROFILE%\Documents\Visual Studio 2015\Visualizers\example.natstepfilter
   * to avoid stepping into std::string ctor and MyWidget ctor.
   */
  setNameWidget("bla", "widgetName");
}
Stepfilter
- Must be saved in
"%USERPROFILE%\Documents\Visual Studio 2015\Visualizers\example.natstepfilter"
(not per-project) - MSDN: Just My Code
Debug.EvaluateStatement
- Execute a function of the process from debugger
- To execute
pt()
, go to Command window:? pt(args)
- Or: Use watch window. Expression/function call is not evaluated automatically on debugger breaks. Add e.g. a space at the end and press enter.
// 03_eval / main.cpp
#include <iostream>
#include <string>
#include "halconcpp/HalconCpp.h"

std::string __buffer;
/* to be called via Debug.EvaluateStatement or ? */
const char* pt(const HalconCpp::HTuple& t) {
  std::cout << t.ToString().Text() << '\n';
  __buffer = t.ToString().Text();
  return __buffer.c_str();
}

int main()
{
  auto bc = HalconCpp::HBarCode(HalconCpp::HTuple(),HalconCpp::HTuple());
  HalconCpp::HImage Image("barcode/ean13/ean1308.png");
  HalconCpp::HTuple DecodedString;

  bc.FindBarCode(Image, "EAN-13", &DecodedString);
  __debugbreak();
  /* Contents of HALCON tuple DecodedString not
   * visible (pimpl). Call embedded function pt
   * to display string in VS Command Window:
   *   ? pt(DecodedString)  */
}
Piecewise execution of a statement
- ALT + 8 -> Assembler view
- Step through assembler code. Function calls should be clearly visible, even to developer that don't know how to read assembler code.
// 04_step_statement / main.cpp
#include <iostream>
#include <string>

#include "halconcpp/HalconCpp.h"

int main()
{
    HalconCpp::HTuple Rand;
    HalconCpp::TupleRand(5, &Rand);
    /* ... */
    __debugbreak();
    /* Execute [] first, then L().
     * Where does exception occur?
     * Use ALT+8 to go to assembler view */
    auto l = Rand[2].L(); // HTupleAccessException!
}
Attach debugger automatically
- Some applications start themselves in multiple processes
- Chrome
- NodeJS
- clang
- ...
- Debugging of events at program start is difficult
- Windows can attach Visual Studio Just-In-Time debugger automatically when a process is started
- (maybe alternatively, use gflags.exe, part of the Windows 10 SDK).
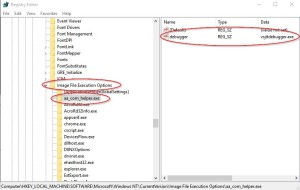
Attach debugger automatically
- Open the Registry Editor
- navigate to
HKEY_LOCAL_MACHINE\Software\Microsoft\Windows NT\CurrentVersion\Image File Execution Options - Select the application you want to debug:
- Either it already exists as subkey, then use that one
- Or, you have to create a new key in Image File Execution Options with the name of the application (e.g. chrome.exe)
- Create a new string value with name debugger and name vsjitdebugger.exe
Questions?
- Andreas Heindl
- info@heindl-solutions.com
- http://www.heindl-solutions.com/
VS2015 project available: demoproject_debugging_vs2015.zip
Created with impress.js available at https://github.com/impress/impress.js